

Story Board Runtime
Once a story board has been designed it can be launched into "runtime" mode. In this mode, all queries and functionalities of the content are activated.
In runtime, the story boards can be presented in 5 different banner modes - depending on the design aesthetic required. See banners for more.
Launching the Story Board Runtime
There are several ways to launch a story board into runtime:
- From inside the designer interface, the designer can click the "Run Dashboard" button on the home tab. This will flip the interface into runtime mode. This process is a great way for designers to see and test their dashboard designs. To see how the story board looks on a mobile device, use the device preview button.
- From the backstage, users can choose to click the "View Story Board" button. This launches the story board into runtime mode rather than into the designer interface.
- Depending on the extended security settings for a given dashboard, a user may ONLY be able to open the story board in runtime mode. Designers can set extended security settings for each role for a given dashboard in the content organizer or the administrative console.
- From a URL address, story boards can be opened and launched directly into runtime mode.
Runtime "Steering Wheel" Menu
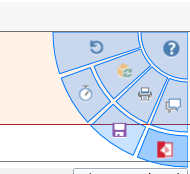
The steering wheel menu in the Story Board runtime is a radial menu for end users to access functions in the dashboard during runtime. The steering wheel provides 5 functions by default:
- Help: this function launches the online help menu.
- Reset All Panels: this resets all panels on the slide to their original settings.
- Re-run All Queries: this re-runs all queries on the current slide based on their current settings.
- Dashboard Timer: this allows you to set a counter or countdown to refresh and cycle through your presentation.
NOTE: If there was a pre-set Dashboard Timer, you can override and choose new settings by clicking on this button.
NOTE: The Dashboard Timers settings adjusted from within the presentation during runtime will NOT be saved for future presentations, that needs to be set from within the dashboard.
- Export/Print: this function provides a dialog for end users to print or export the current dashboard. See distribution for more.
- Save Dashboard this function allows end users to save the current dashboard into their private domain.
- Conversations this function shows the conversations tab for collaboration within the running story board.
- Return to Story Board: this function is present when the current dashboard was launched from either the designer interface or the backstage.
Runtime Functions and Interactivity
Slide Context Menu
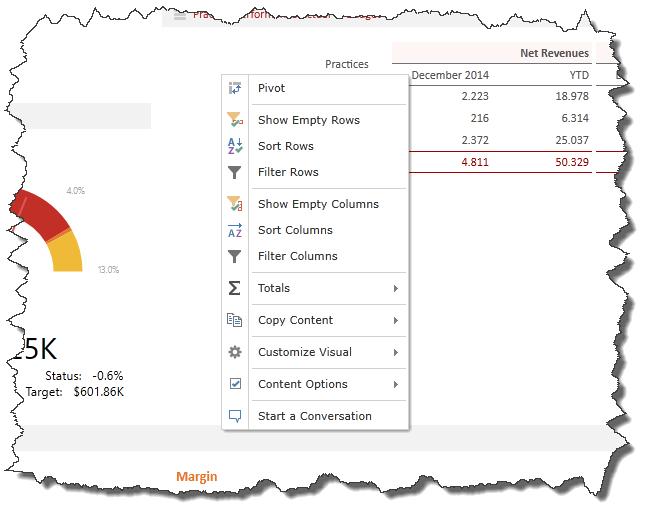
This context menu is like the Data Discovery reporting context menu, allowing users to pivot queries, hide empty columns/rows; filter and sort content and show totals for the currently selected panel. Importantly, this menu exposes the Quick Export to Excel function, which is a convenient way to export the data in the currently selected panel to Excel for alternative analysis. See the Data Discovery context menu help for more information.
Story Board Report Component Interactivity
Reporting components in the dashboard reflect all the same right-click context menu's found in the Data Discovery application. Depending on the component type (grid, chart etc) these menus will allow users to drill down/up, dice data and perform analytics like quick sorts and filters. See the Data Discovery context menu help for more information.
Interactions
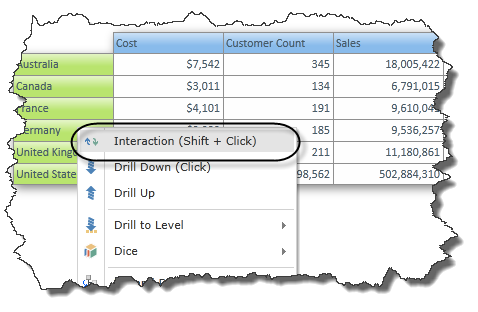
One notable addition to the Story Board report component context menus is the "Interaction" option (which can also be activated with SHIFT+Click). This menu item will cause the selected item in the content exhibit to "interact" with its designated target queries on the slide panel. See Interactions for more.
Panel Context Menus
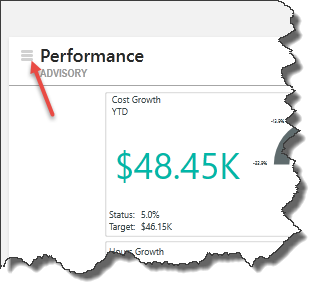
Hovering over the panel's "power square" menu (red arrow) will provide meta data on the current panel and its query.
Double clicking on the power square will either zoom in or out the current panel.
Right clicking on the square will expose a context menu. This menu reflects almost identical functionality to the toolbox context menu found in the canvas designer interface. However, the power square menu does not allow users to remove content, change captions or change its interaction settings. Instead is provides the following functions for all panels:
- Analyze in Data Discovery - takes the current content item and query and launches it into the Data Discovery application. From here, the user can use most of the Data Discovery application for further analyzing the Story Board exhibit. Once complete, the user can click on the execute button in Data Discovery to return to the Story Board dashboard.
- Swap (to Grid or Back) - this menu option is available on charts, maps and gauges and will allow the user to swap the graphic visualization to a grid and back
- Zoom to Full / Original - used to expand the current panel to full screen or conversely collapse it down to its original size
- Panel Reset - this resets the panel to its original settings.
- Re-run Query - re-runs the panel's query based on its current settings
- Go Back- this provides a mechanism to step backwards to the previous query action.
No-Panel Context Menus
If panels have not been activated for a slide, the panel context menus that would typically be found using the power square can be found attached to the slide context menus (as described above)
Home |
Table of Contents |
Index |
User Community
Pyramid Analytics © 2011-2022